Client: Google Arts and Culture
Concept: Pekka Niittyvirta & Timo Aho.
Data & design: Koponen+Hildén
Code: Map: Viljami Peltola
Code: Street View: Ville Niemi, Janne Aukia
Code: Backend/Python & essential work + handyman: Henry Jalonen
Scientific validation: IPCC Scientist Jouni A. Räisänen; Finnish Environment Institute Scientist Mikael Hilden
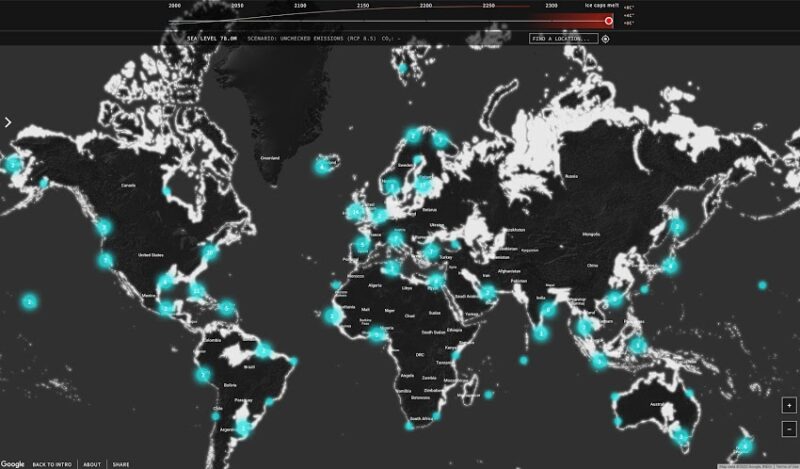
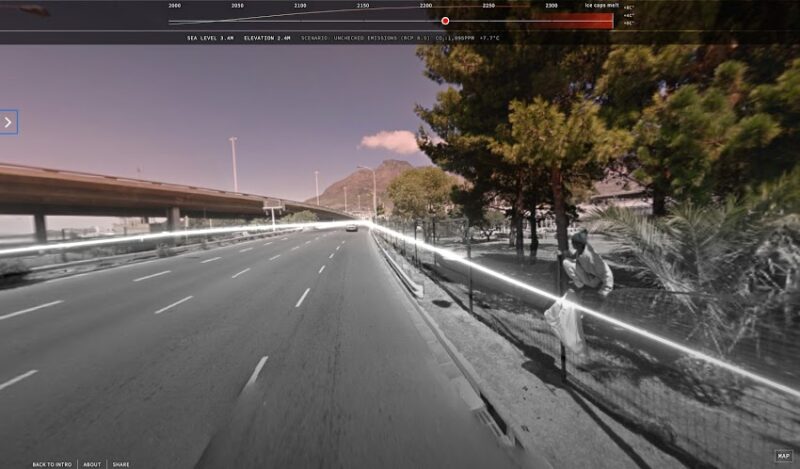
An interactive web application presenting rise of sea levels by two visualisation methods using Google Maps-based technologies: map and street-view.
My responsibility within the project was to code the rising water level for the street view visualisation. I carried on from solid code by Janne Aukia and provided the final 3D-based rendering.

Below text via Experiments with Google
A Map and Street View experiment visualising the actual and predicted global sea level rise caused by the climate crisis. All data and analysis provided by the artist.
The artists Timo Aho and Pekka Niittyvirta invite audiences to explore a world where sea levels rise and instability increases the further we advance into the future. Using Google Street View and Google Maps, the artwork uses data from Climate Central and findings from the UN’s IPCC report to visualise present and future sea level rise and simulates the migration caused by rising global temperatures. Coastline Paradox is a continuation of their physical installation ‘Lines’ and combines multiple datasets, elevation models and 3d rendering to bring it to online audiences.

View it here: https://artsexperiments.withgoogle.com/coastline-paradox/
